

This is an excerpt from our new AI intelligence services via Kanops.ai - due to the wonders of modern technology, we are able to use our imagery to provide cutting edge insight and intelligence for retailers, suppliers and anyone else in between.
Get in touch to see how we may help you.
We have almost 1.3m images now, they’re varied, from 2009 to present day and more than just the same bay over and over again without any context of the next aisle, the ends or the wider marketing campaigns at the time.
Therefore this treasure trove of history can be used, to great effect, with our AI tooling to start to generate analysis, comparative sets and identify trends with our AI brain “Cartwright” well equipped to help identify opportunities with training on 36k of my emails and thousands of documents, plus 100,000 tweets too!
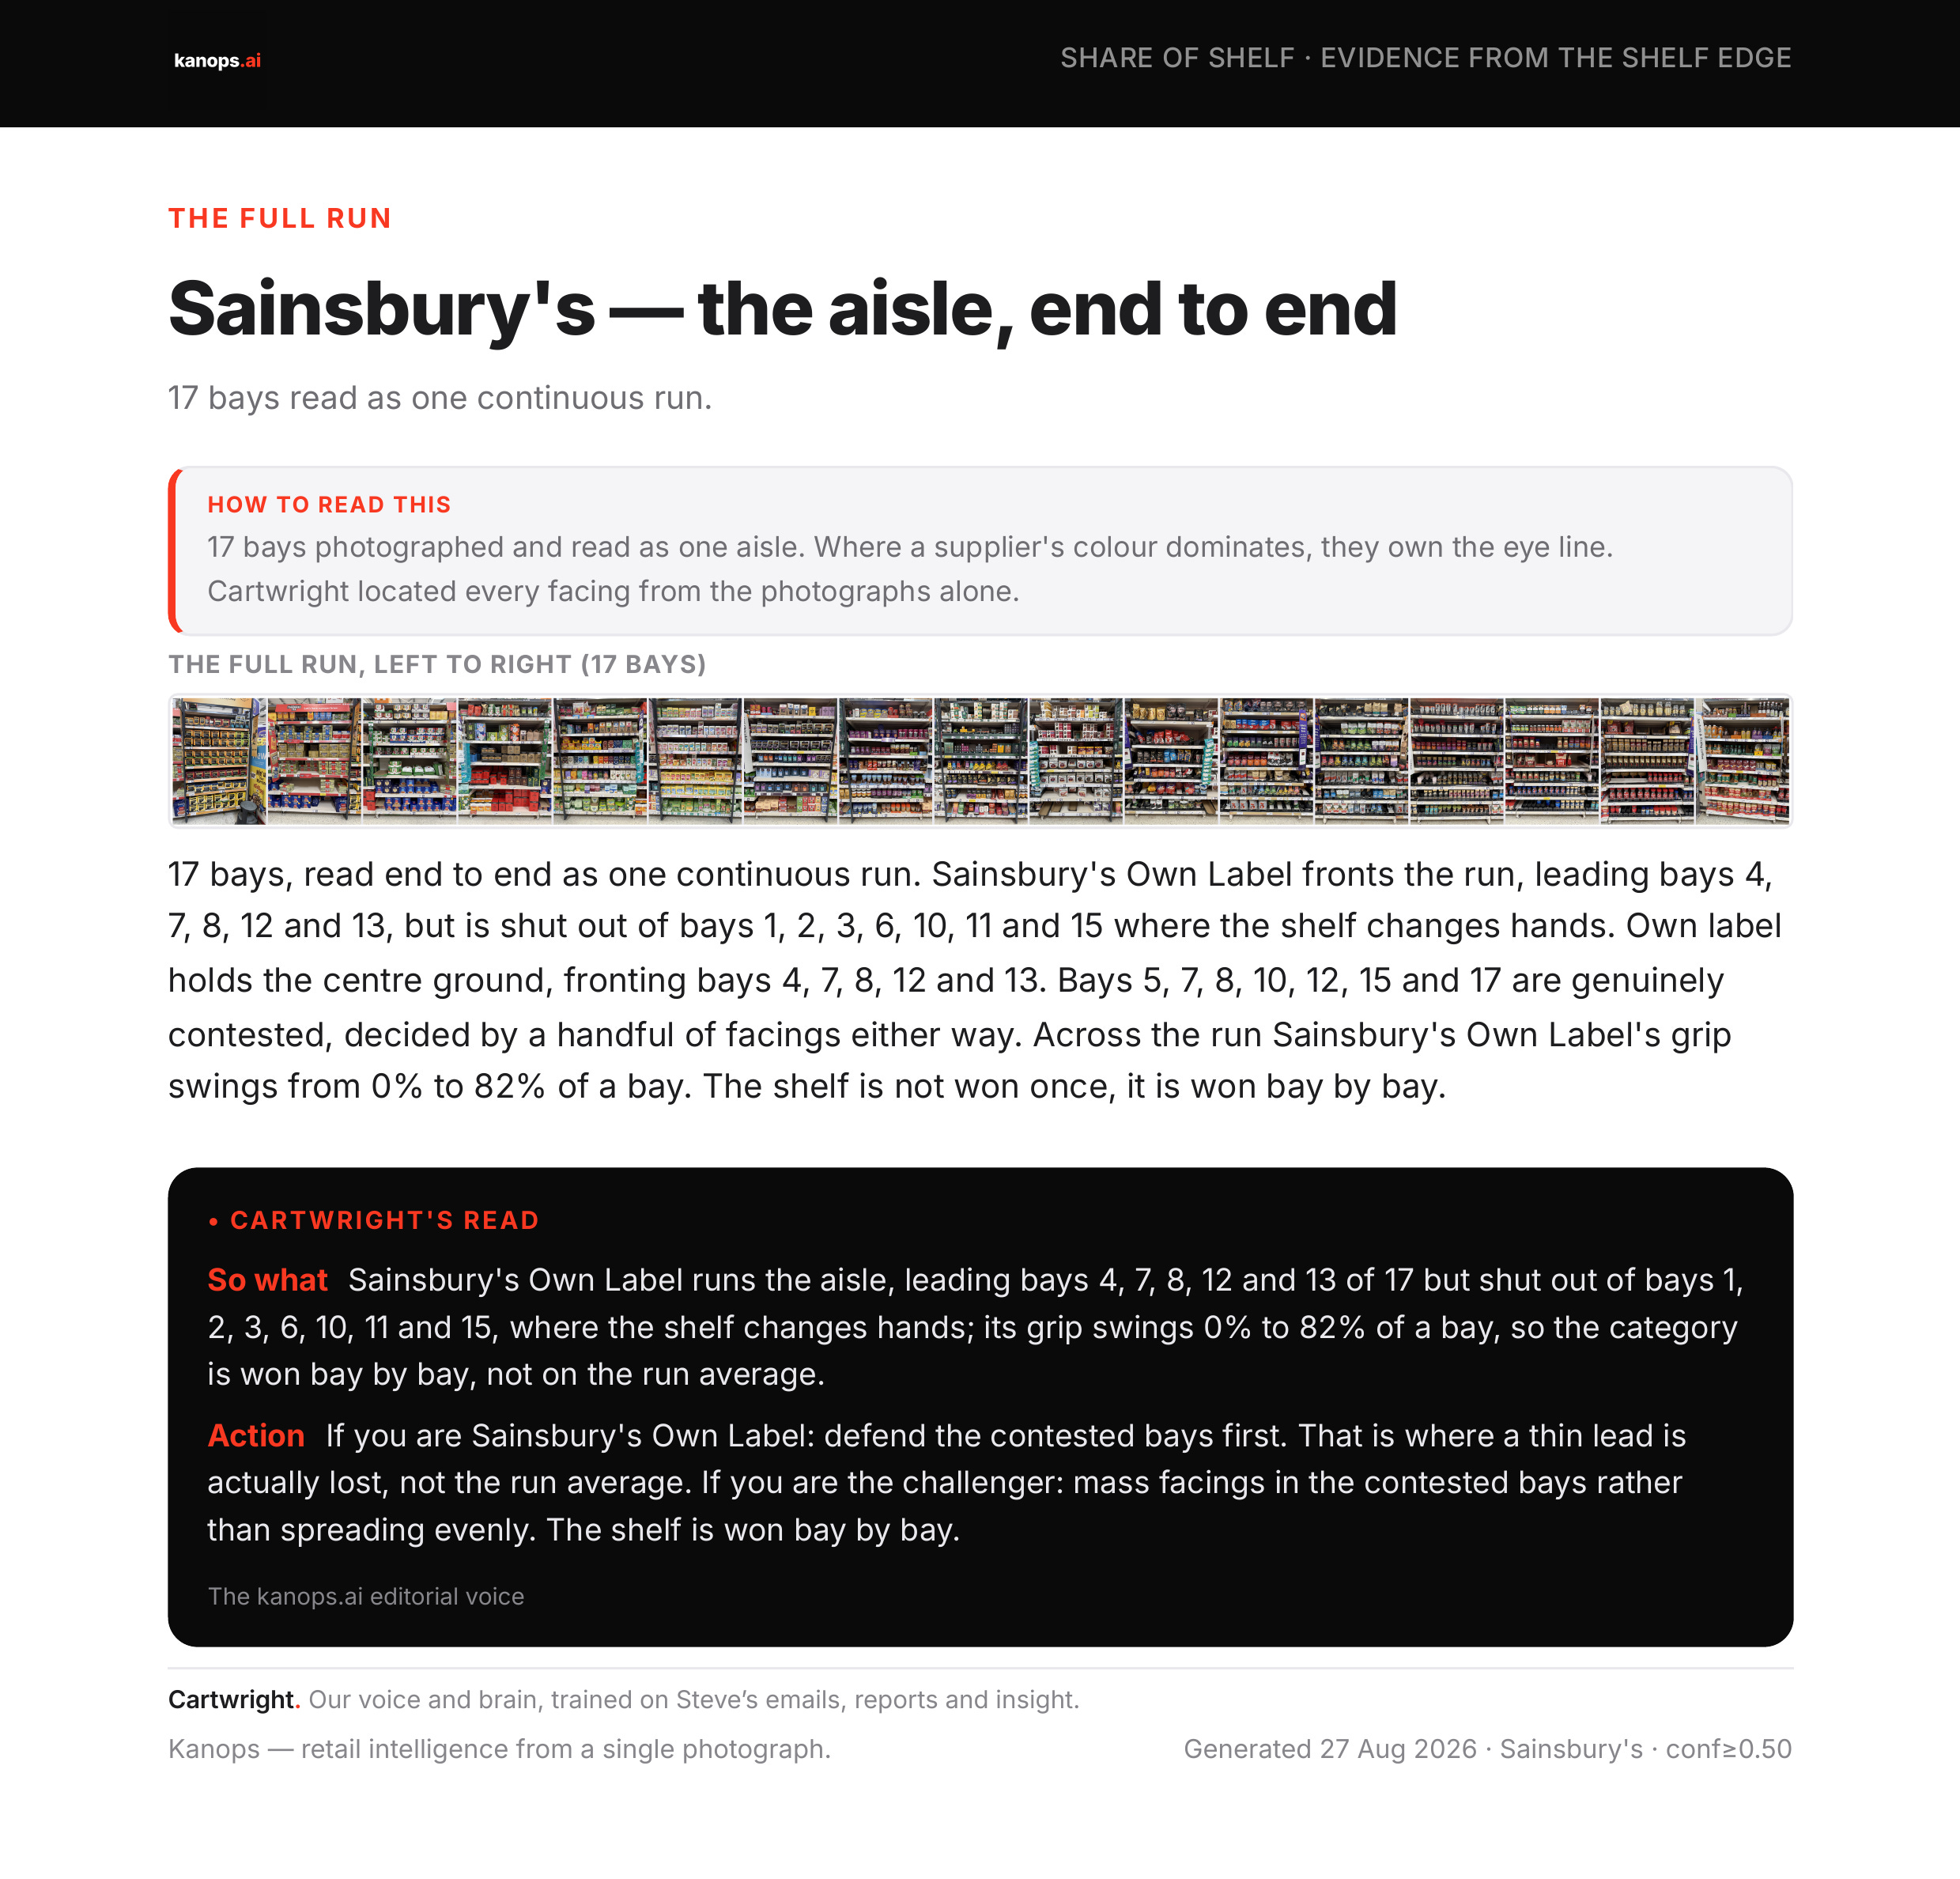
Recently we walked the full Tea and Coffee run at Sainsbury’s. Seventeen bays, end to end, from Everyday Tea through to Coffee Sachets.
We photographed every bay, as we do through our visits, then sat down and read every facing, every price, and every promotion with our AI tooling and models.
The great thing with AI is that it learns quickly and you can tailor things rapidly if you know what you want from the analysis. We’ve trained our models to recognise facings, shelf edge labels, signage, retail media, gaps, lows, the list goes on.
So what do we see?
Well, over 1,000 facings. 42 separate suppliers and 9 sub-categories all sharing one aisle.
Of course, this is just one store, there are larger and smaller assortments, but the point of the analysis is that it’s what your customer experienced in this store, on this day.
We can add more store sizes to run a fuller comparative.
The next comparative we are running is retailer v.s retailer. IE how does Tesco compare to Sainsbury’s? What are the commonalities and differences?
What is the % of range that’s own label? Then Cartwright can advise on where the specific range gaps are - IE you’re under represented in Coffee Beans, then he will see that, plus the historical picture.
No planogram (we can generate them) No EPOS data, no loyalty data (although we can overlay both in time!)
Just what the customer sees. The true availability, the facings, the plan, the set up. the signage, right at the time on the shelf edge.
The images are excerpts from the report that our system generates.
Own label leads. Just.
Sainsbury’s with their own label ranges takes 19.7% of the category overall0.
ABF sits at 16.2%, (they own Twinings) and Nestle have 14.7%.
A 3.5% gap across numerous categories. Not unsurprising and if anything, positive for the customer.
That is a lead you defend every week and forms part of a wider strategy for Sainsbury’s to ensure their own label sits in and offers the customer value and quality.
The top three suppliers hold just over half the overall shelf between them, which is expected given trade spend and popularity of these brands.
The other half belongs to 39 other suppliers. This is a heavily contested category with challenger brands, new to market sub categories and trends across the piece.
The aisle average is meaningless though, it’s more about the space split and who owns what in the customer flow as you look at the category end to end.
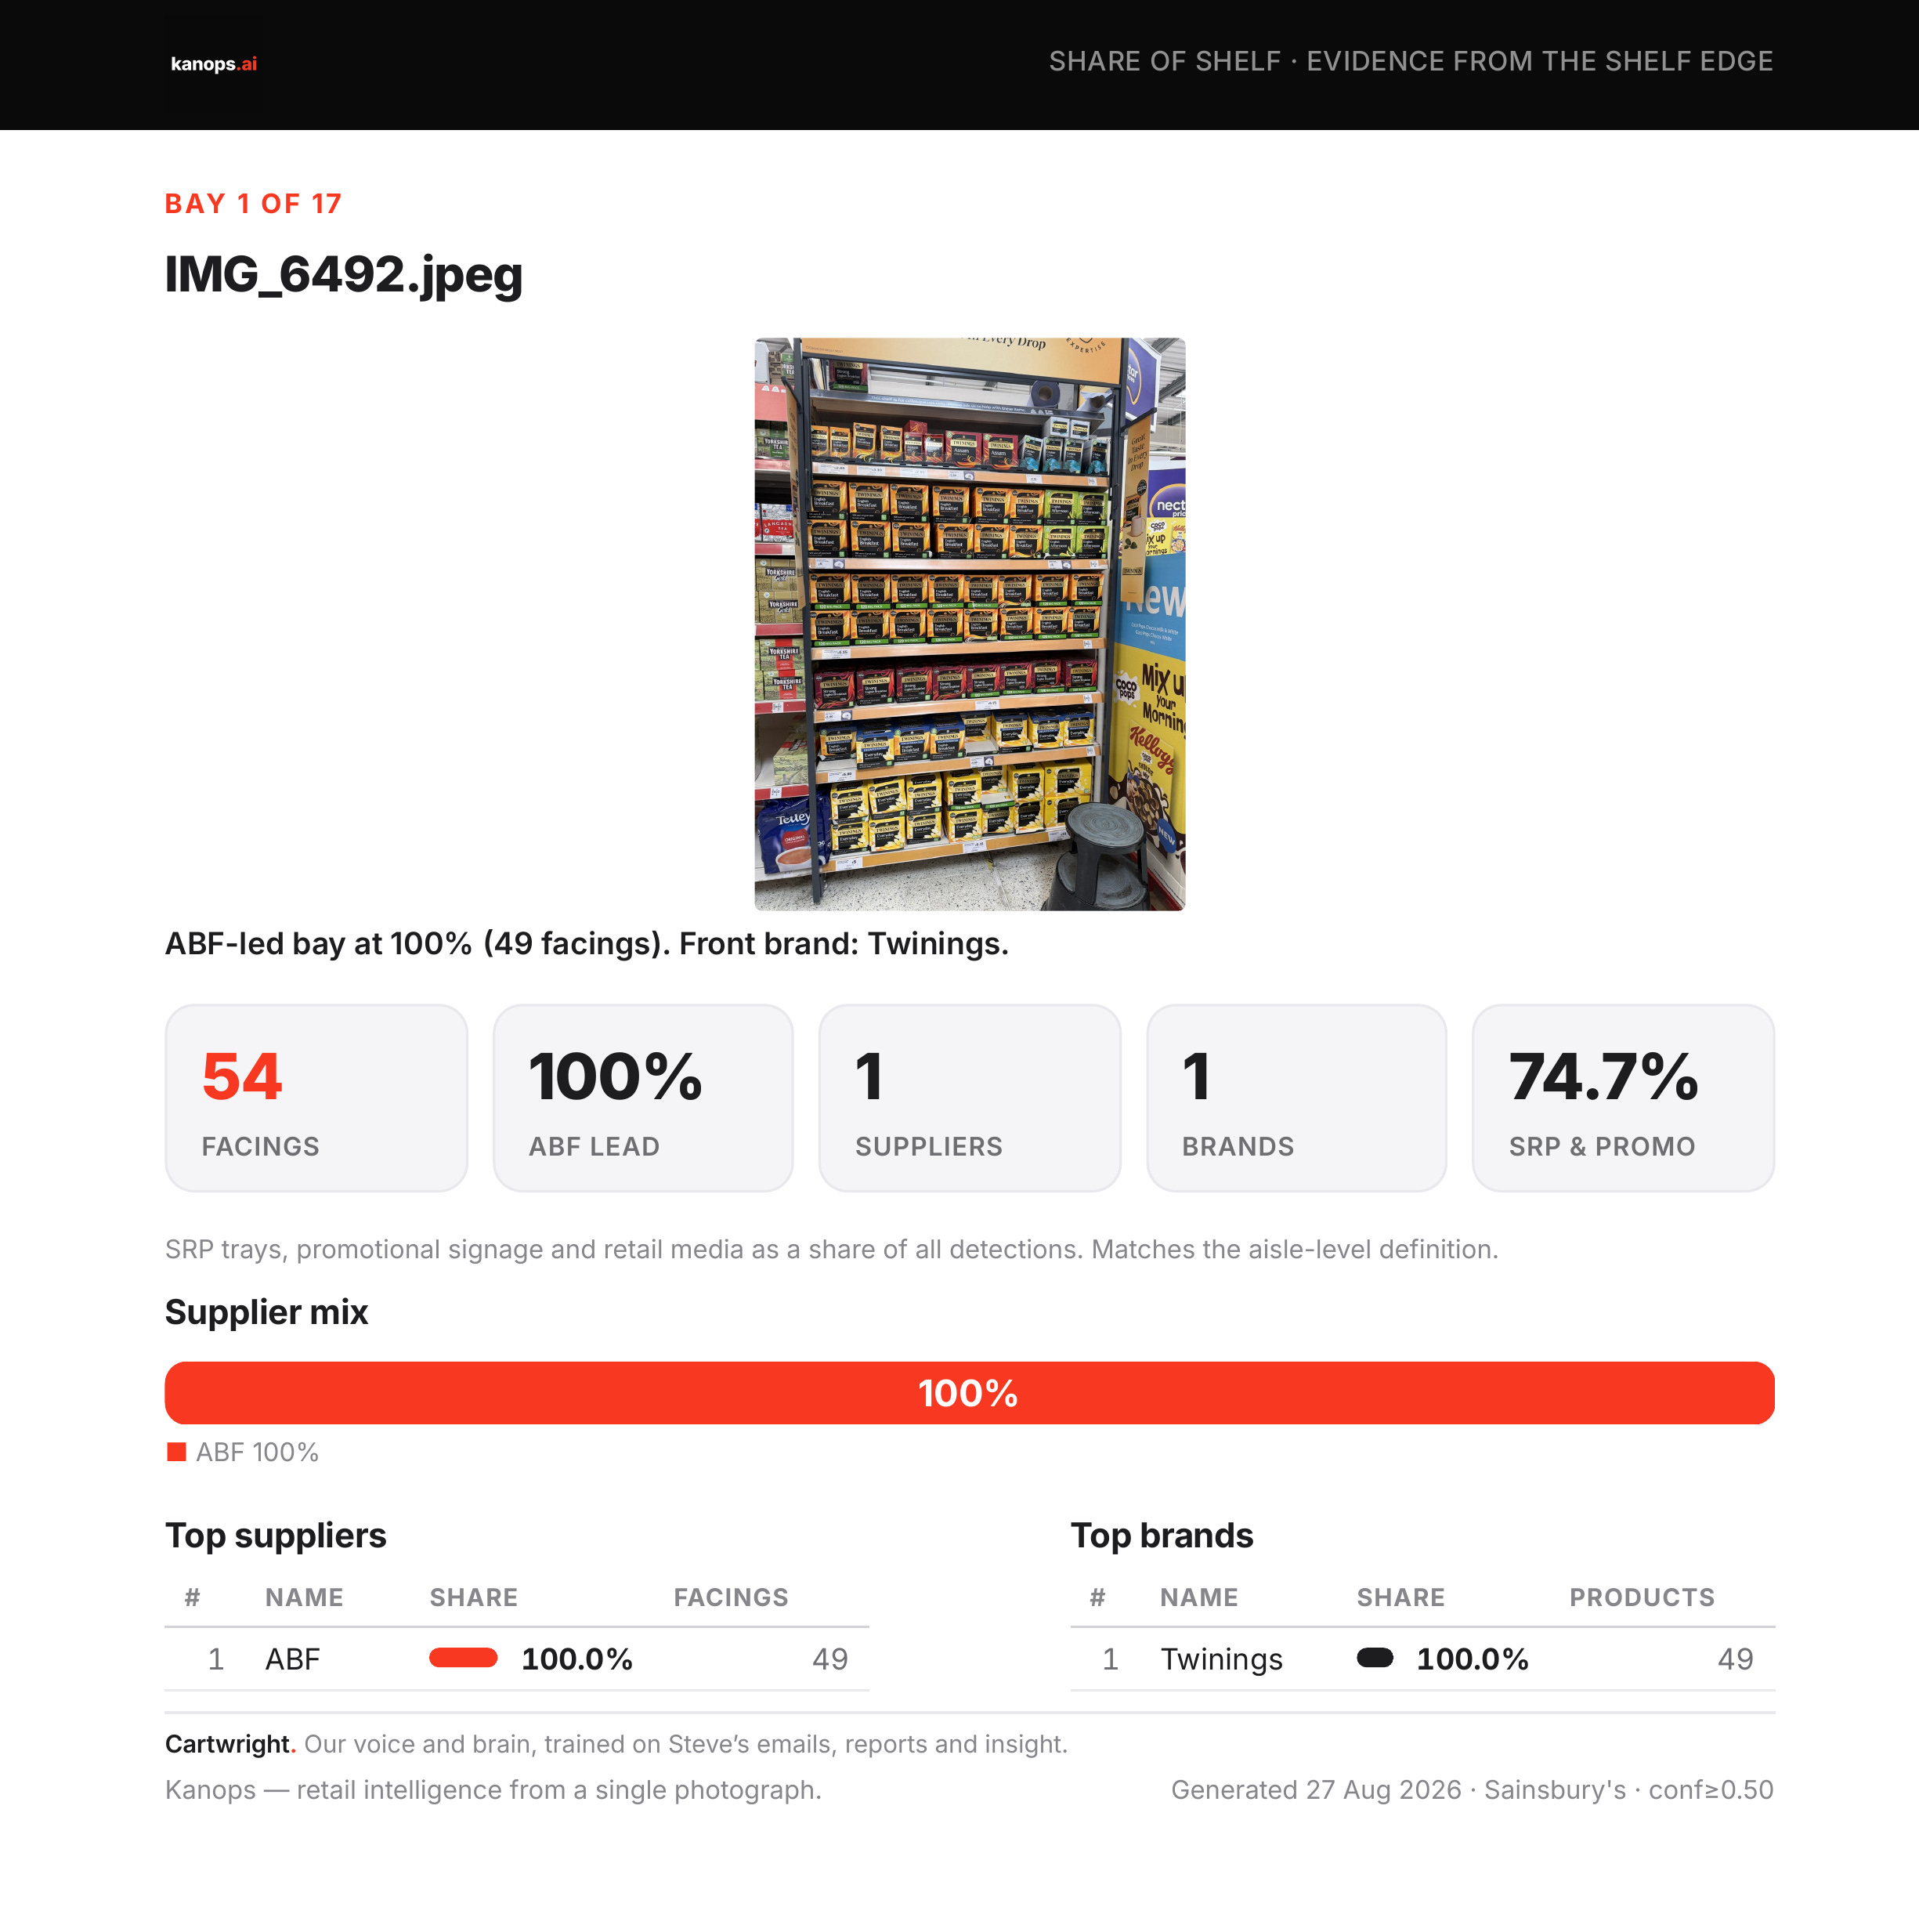
Stand in front of Bay 1 and you are looking at a wall of Twinings. ABF at 100% here, complete with retail media to support the investment. Well done!
Own label does not exist here, the first bay the customer sees, there is no own label.
Move to Bay 4 however, and the own label holds 82% of the bay. Speciality Tea, almost entirely By Sainsbury’s.
Then Bay 11, Coffee Beans. Lavazza is at 46%, Taylor’s of Harrogate at 15%, Costa Coffee at 13%. Own label has zero facings here in this bay, but plenty on the adjacent one.
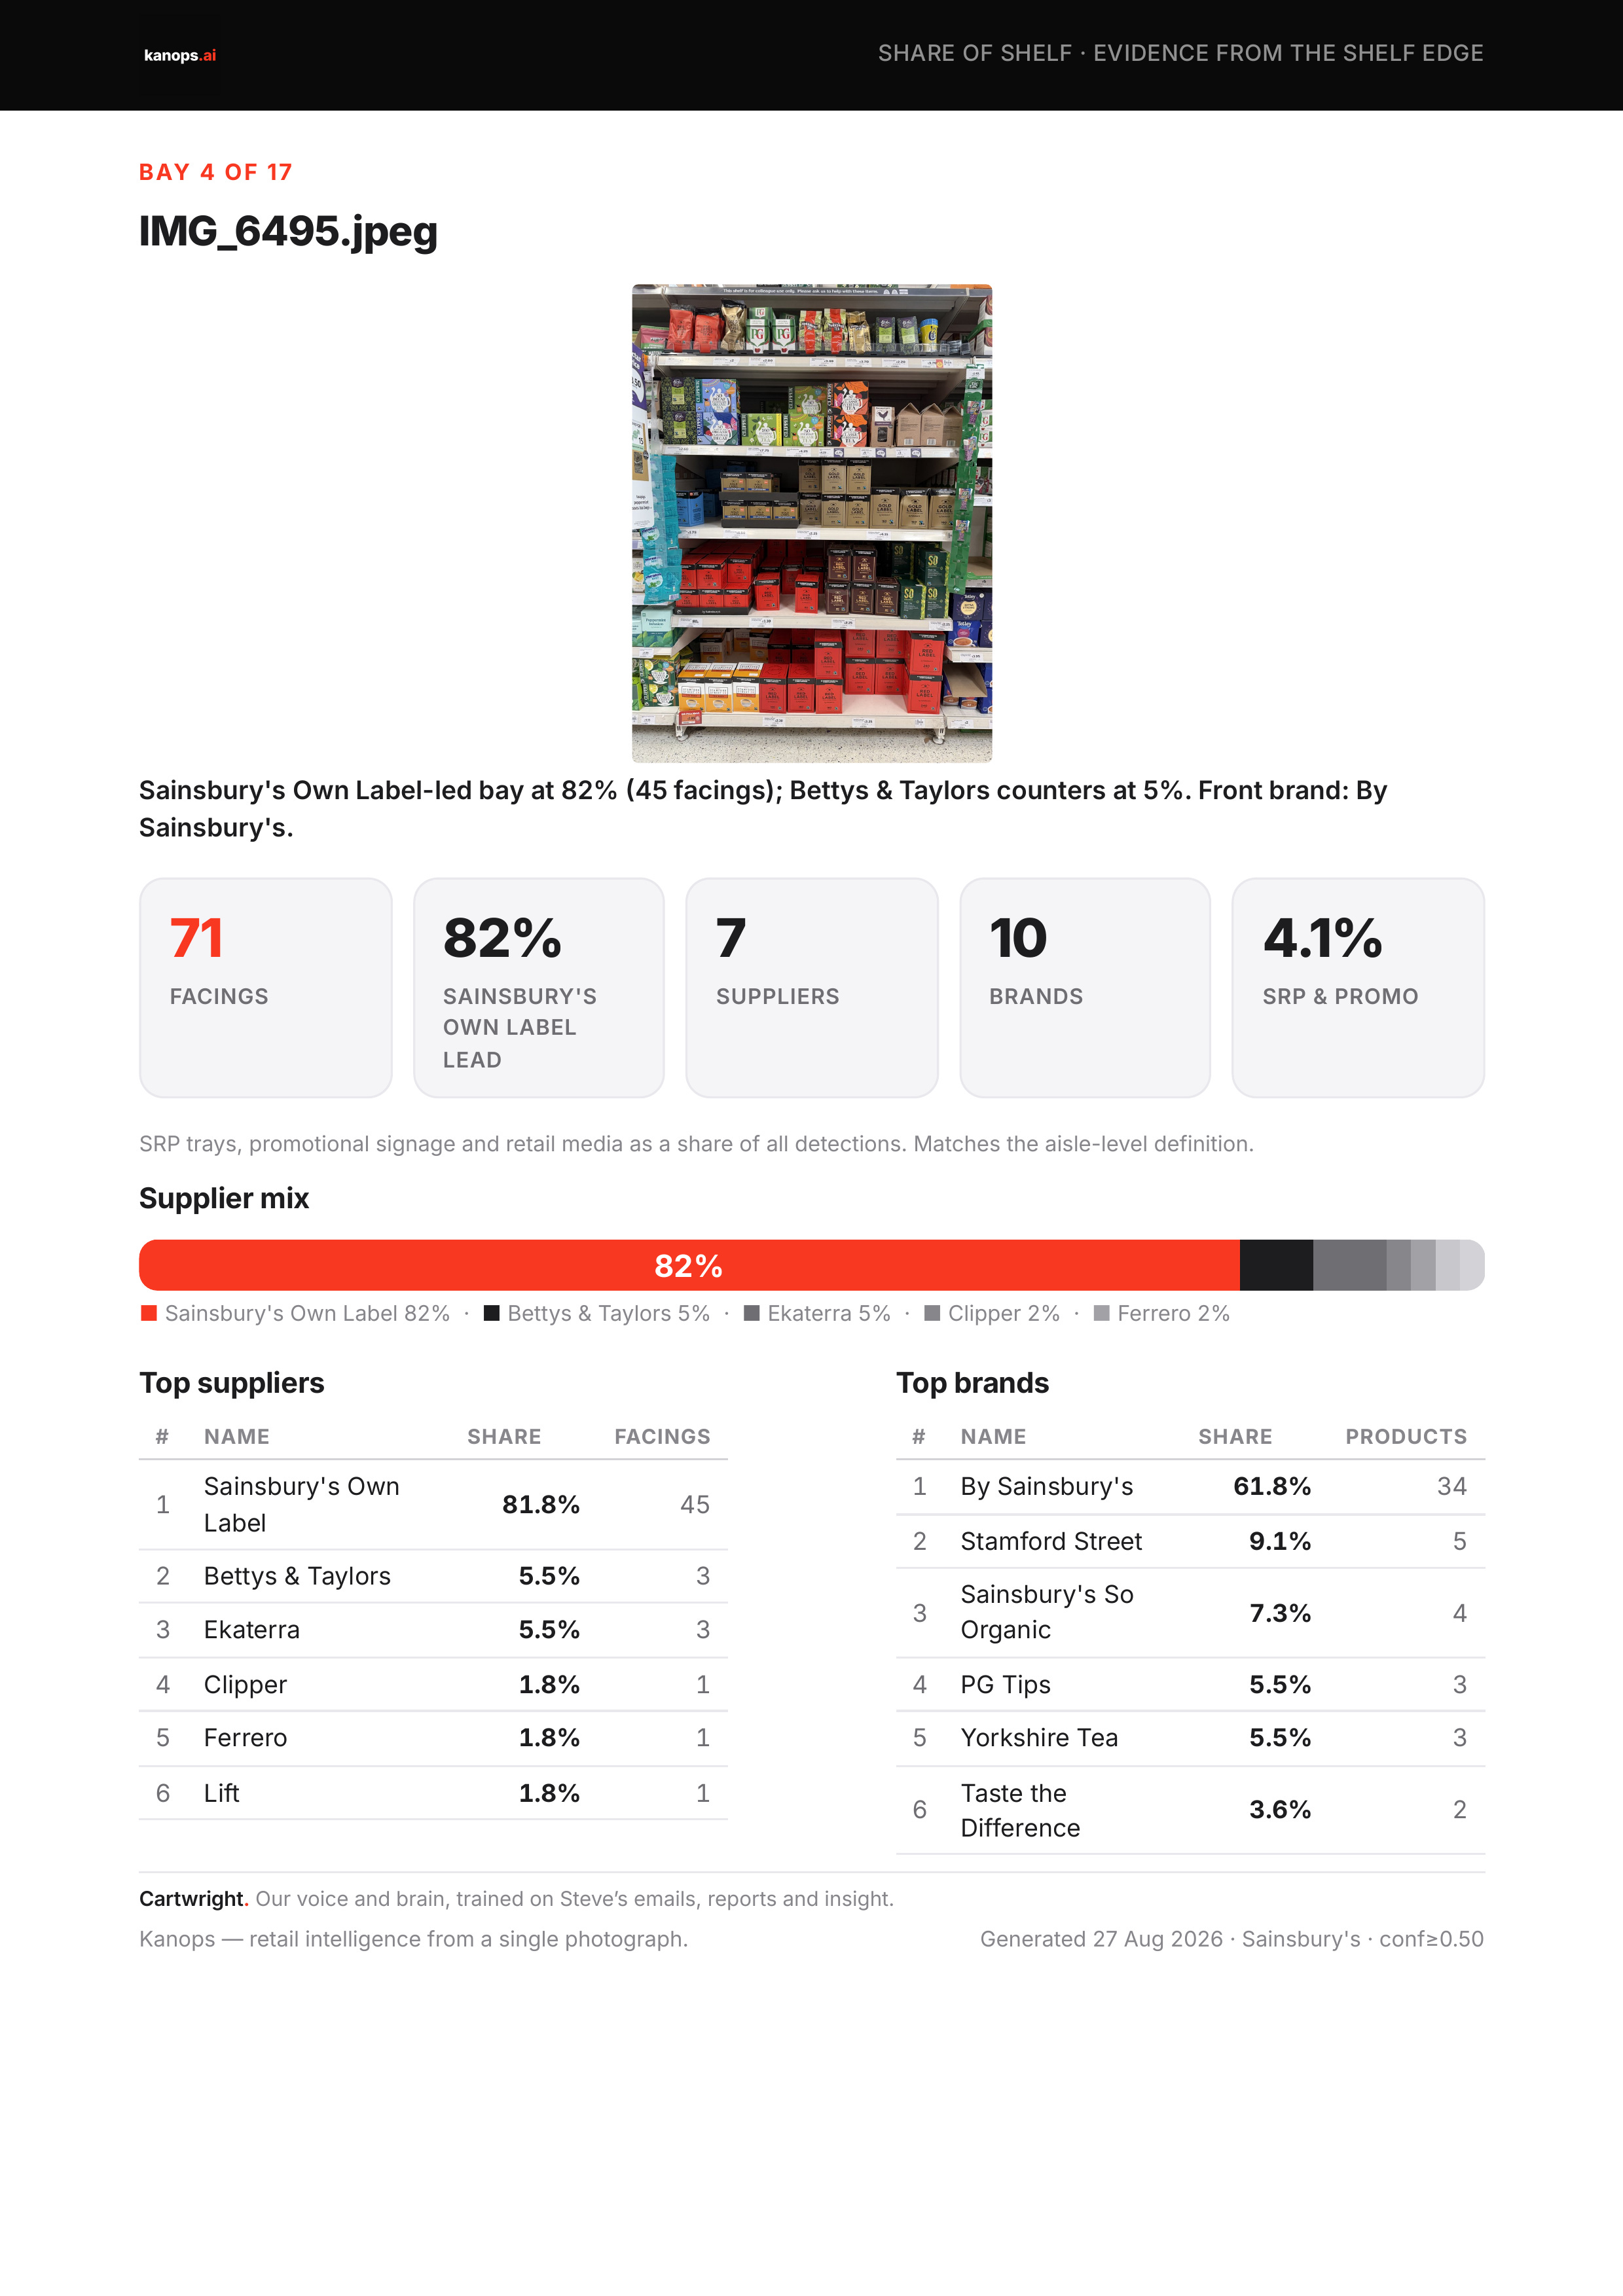
Own label’s share swings from 0% to 82% across seventeen bays.
Two of the nine sub-categories are genuinely contested with various brands featured. Seven are decided with dominant players.
If you plan against the average you are wrong in both directions, therefore the strategy has to be to pay to anchor a bay, or ensure you get the best in fixture space in the category.
The sub-category picture:
**Speciality Tea** (Bays 4, 7) -- own label leads at 55%. Dominated.
**Coffee Beans** (Bay 11) -- Lavazza at 46%. No own label. Dominated.
**Everyday Tea** (Bays 1-3) -- ABF at 41%, Yorkshire Tea at 27%, PG Tips at 21%. No own label. Controlled.
**Instant Coffee** (Bays 14, 16) -- Nestle at 43%. Nescafe owns this fixture. Controlled.
**Ground Coffee** (Bays 12-13, 15) -- own label leads at 28% but Lavazza and Taylor’s contest. Contested.
**Hot Chocolate** (Bay 8) -- own label at 26%, Nestle at 17%, Horlicks at 13%. Eleven suppliers. Contested.
**Coffee Machine Pods** (Bays 9-10) -- Nestle leads with Dolce Gusto, Mondelez contests with Tassimo at 44% of Bay 10. Controlled.
**Coffee Sachets** (Bay 17) -- Mondelez at 37% (Kenco), Nestle at 31% (Starbucks, Nescafe). Controlled.
**Fruit and Herbal Tea** (Bays 5-6) -- ABF at 52% (Twinings). Dominated.
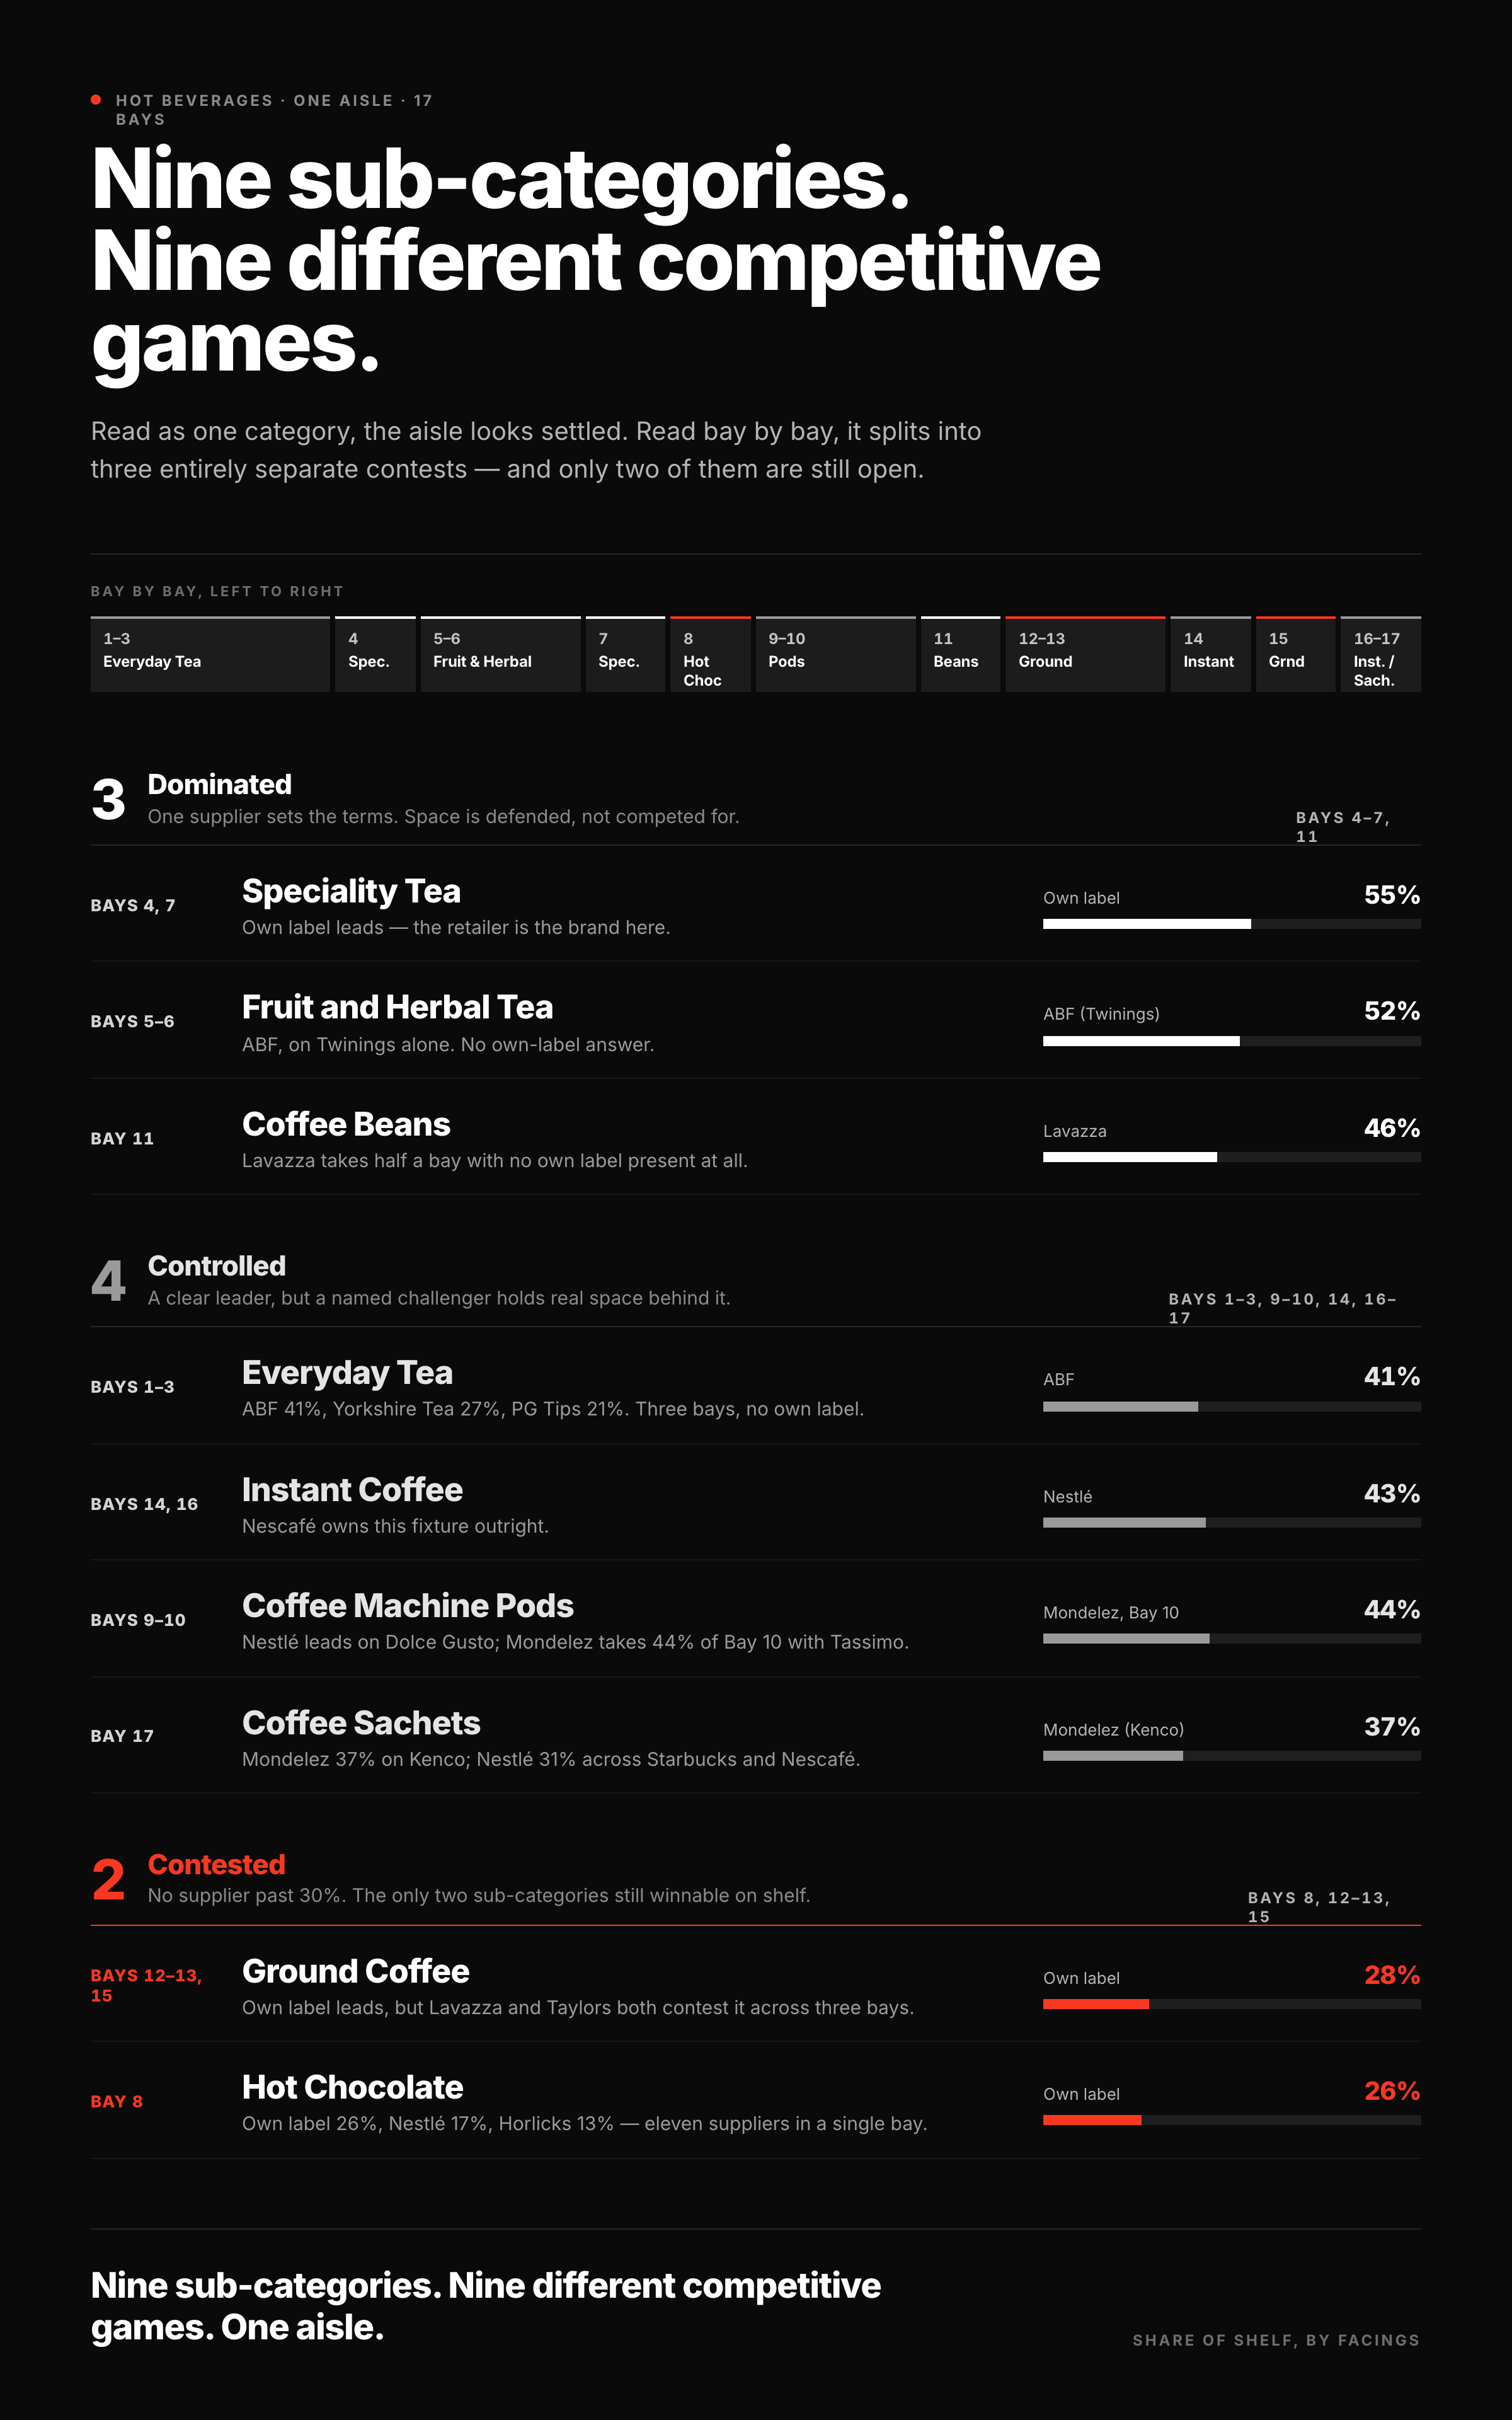
Nine sub-categories. Nine different competitive games. One aisle.
Of course we can go deeper and split categories further to reflect other trends that sit within a bay, such as Cold Brew and the like.
The price story (and promo!)
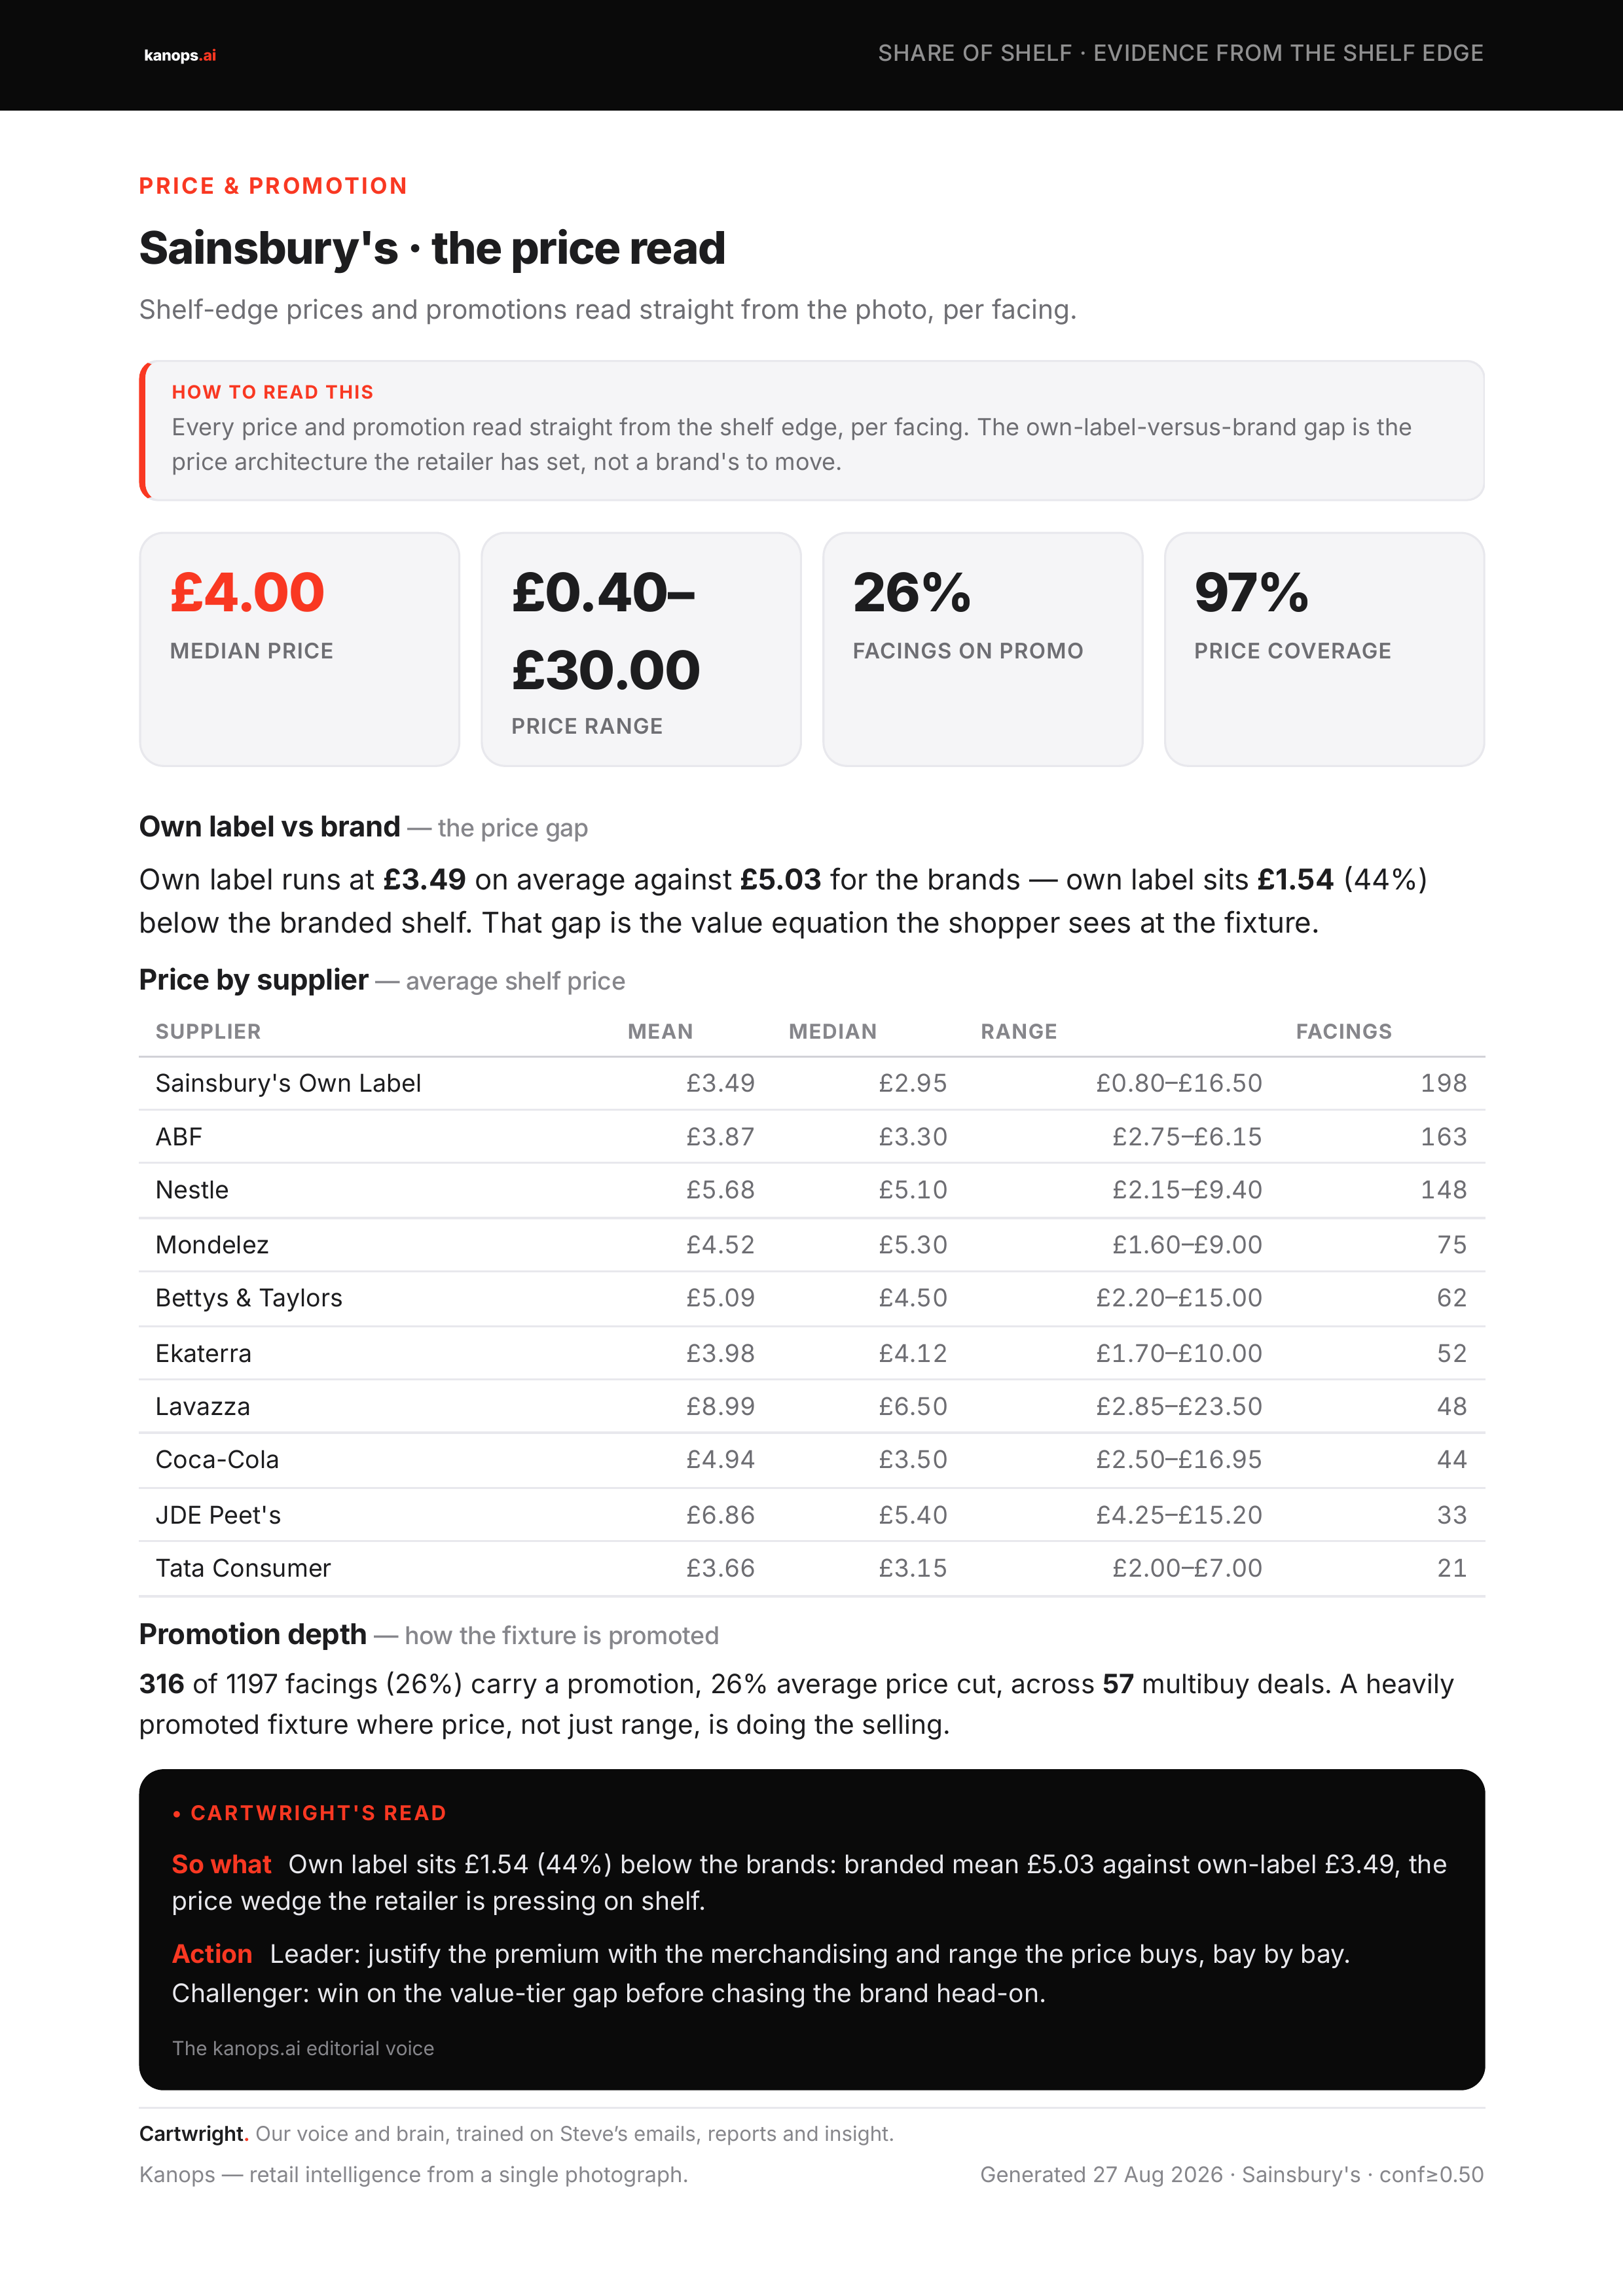
Own label runs at £3.49 on average. Branded runs at £5.03. A £1.54 gap.
Own label sits 44% below the brands on a price average.
Lavazza averages £8.99. Nestle averages £5.68. ABF averages £3.87.
The price architecture is visible from the aisle before you pick anything up.
26% of facings carry a promotion. 57 separate multibuy deals across the run. This is a fixture where price is doing the selling, not just range, we know Coffee and be a hi/lo category and this plays out.
We also know that this price read changes…
The great thing is, that you can re-run this analysis 6 weeks later, with a new promotional cycle and then replicate the analysis, building up a pattern of trade.
Of course, Kanops can also go back in the archive to sweep everything Tea and Coffee related and work it in to the category intelligence.
Meaning you can get a comprehensive view of price and promotion on any category.
Showing what the space split were like in the past, what price points and deals were active. Leading to a true measure of inflation, and shrinkflation….
Using the past to predict the future……
So what would you do?
If you are Sainsbury’s with their own label strength: forget the averages, it’s a strong category for them in terms of own label.
The own label has a strong presence and the ability to keep these lines on sale without replenishing in day is the key here, so the space split is explained by this, there are many factors that go in to space allocations.
The contested middle is where the category is decided, other brands are given over to brands for commercial reasons, but the customer is never far from the mind. It’s unlikely Sainsbury’s would give a bay over to a poorer selling Tea, but Twinings.
It does make sense.
Massing facings in the contested bays is important to gain visibility, however remember that the space allocation is also operational, no store wants “dead space” whilst fast selling lines are being filled in day.
The shelf is won bay by bay, not on the averages, Commanding strong shelf location (eye level etc etc) is important in the relevant bay.
If you are sitting in a category team looking at this from head office: then the questions change again. Sainsbury’s respect their own label, so where are gaps to get in authoritatively without impacting operations or being told no, due to sales rates or range count, even?
Indeed, promotions are important too, so expect an element of cannibalisation but ensuring that your place in category is justified and well backed, always helps.
Our methodology
I/we photograph shelves and we have done since 2009. Millions of images across 100+ retailers worldwide, every week, covering the full store. Whether that’s foyer, aisle, seasonal, chilled, ambient, wherever.
Not scraped, not licensed, not fixed infrastructure. I walk in and photograph what the customer sees, it’s the only dataset in existence that has this depth.
This analysis reads every facing from those photographs: product, brand, supplier, price, promotion and writes up a commercial read of the category.
One store, one category, 17 photographs here. The same read runs across retailers, across time, across events to provide a comparator.
That is what seventeen years of continuous observation gives you. Depth that nobody else has, because nobody else started in 2009.
**Next time:** the same category at a different retailer. Same method. Different answer. Then a comparative!
Want to join our pilot programme?
You can work with me directly as we work together with our images (or yours as well) to shape the category of the future, looking at what's gone before it. Alongside our best practice from around the world too.
Just get in touch to express your interest and you can help shape the tooling too.