


Part of our work with Kanops.ai is using our next gen AI tooling to aggregate and correlate our imagery, using all manner of data points to generate category and wider retail insight that genuinely helps the supplier, the retailer and ultimately, the customer.
For example - a simple piece of technology measuring when images were actually taken by the team in store, means you can (with the appropriate image sorting) show which categories landed when, by which retailer.
This is important for phasing of seasonal events, IE what lands when, plus the dark art of trade planning which is one of the most important activities a retailer undertakes.
It’s a real skilled job.
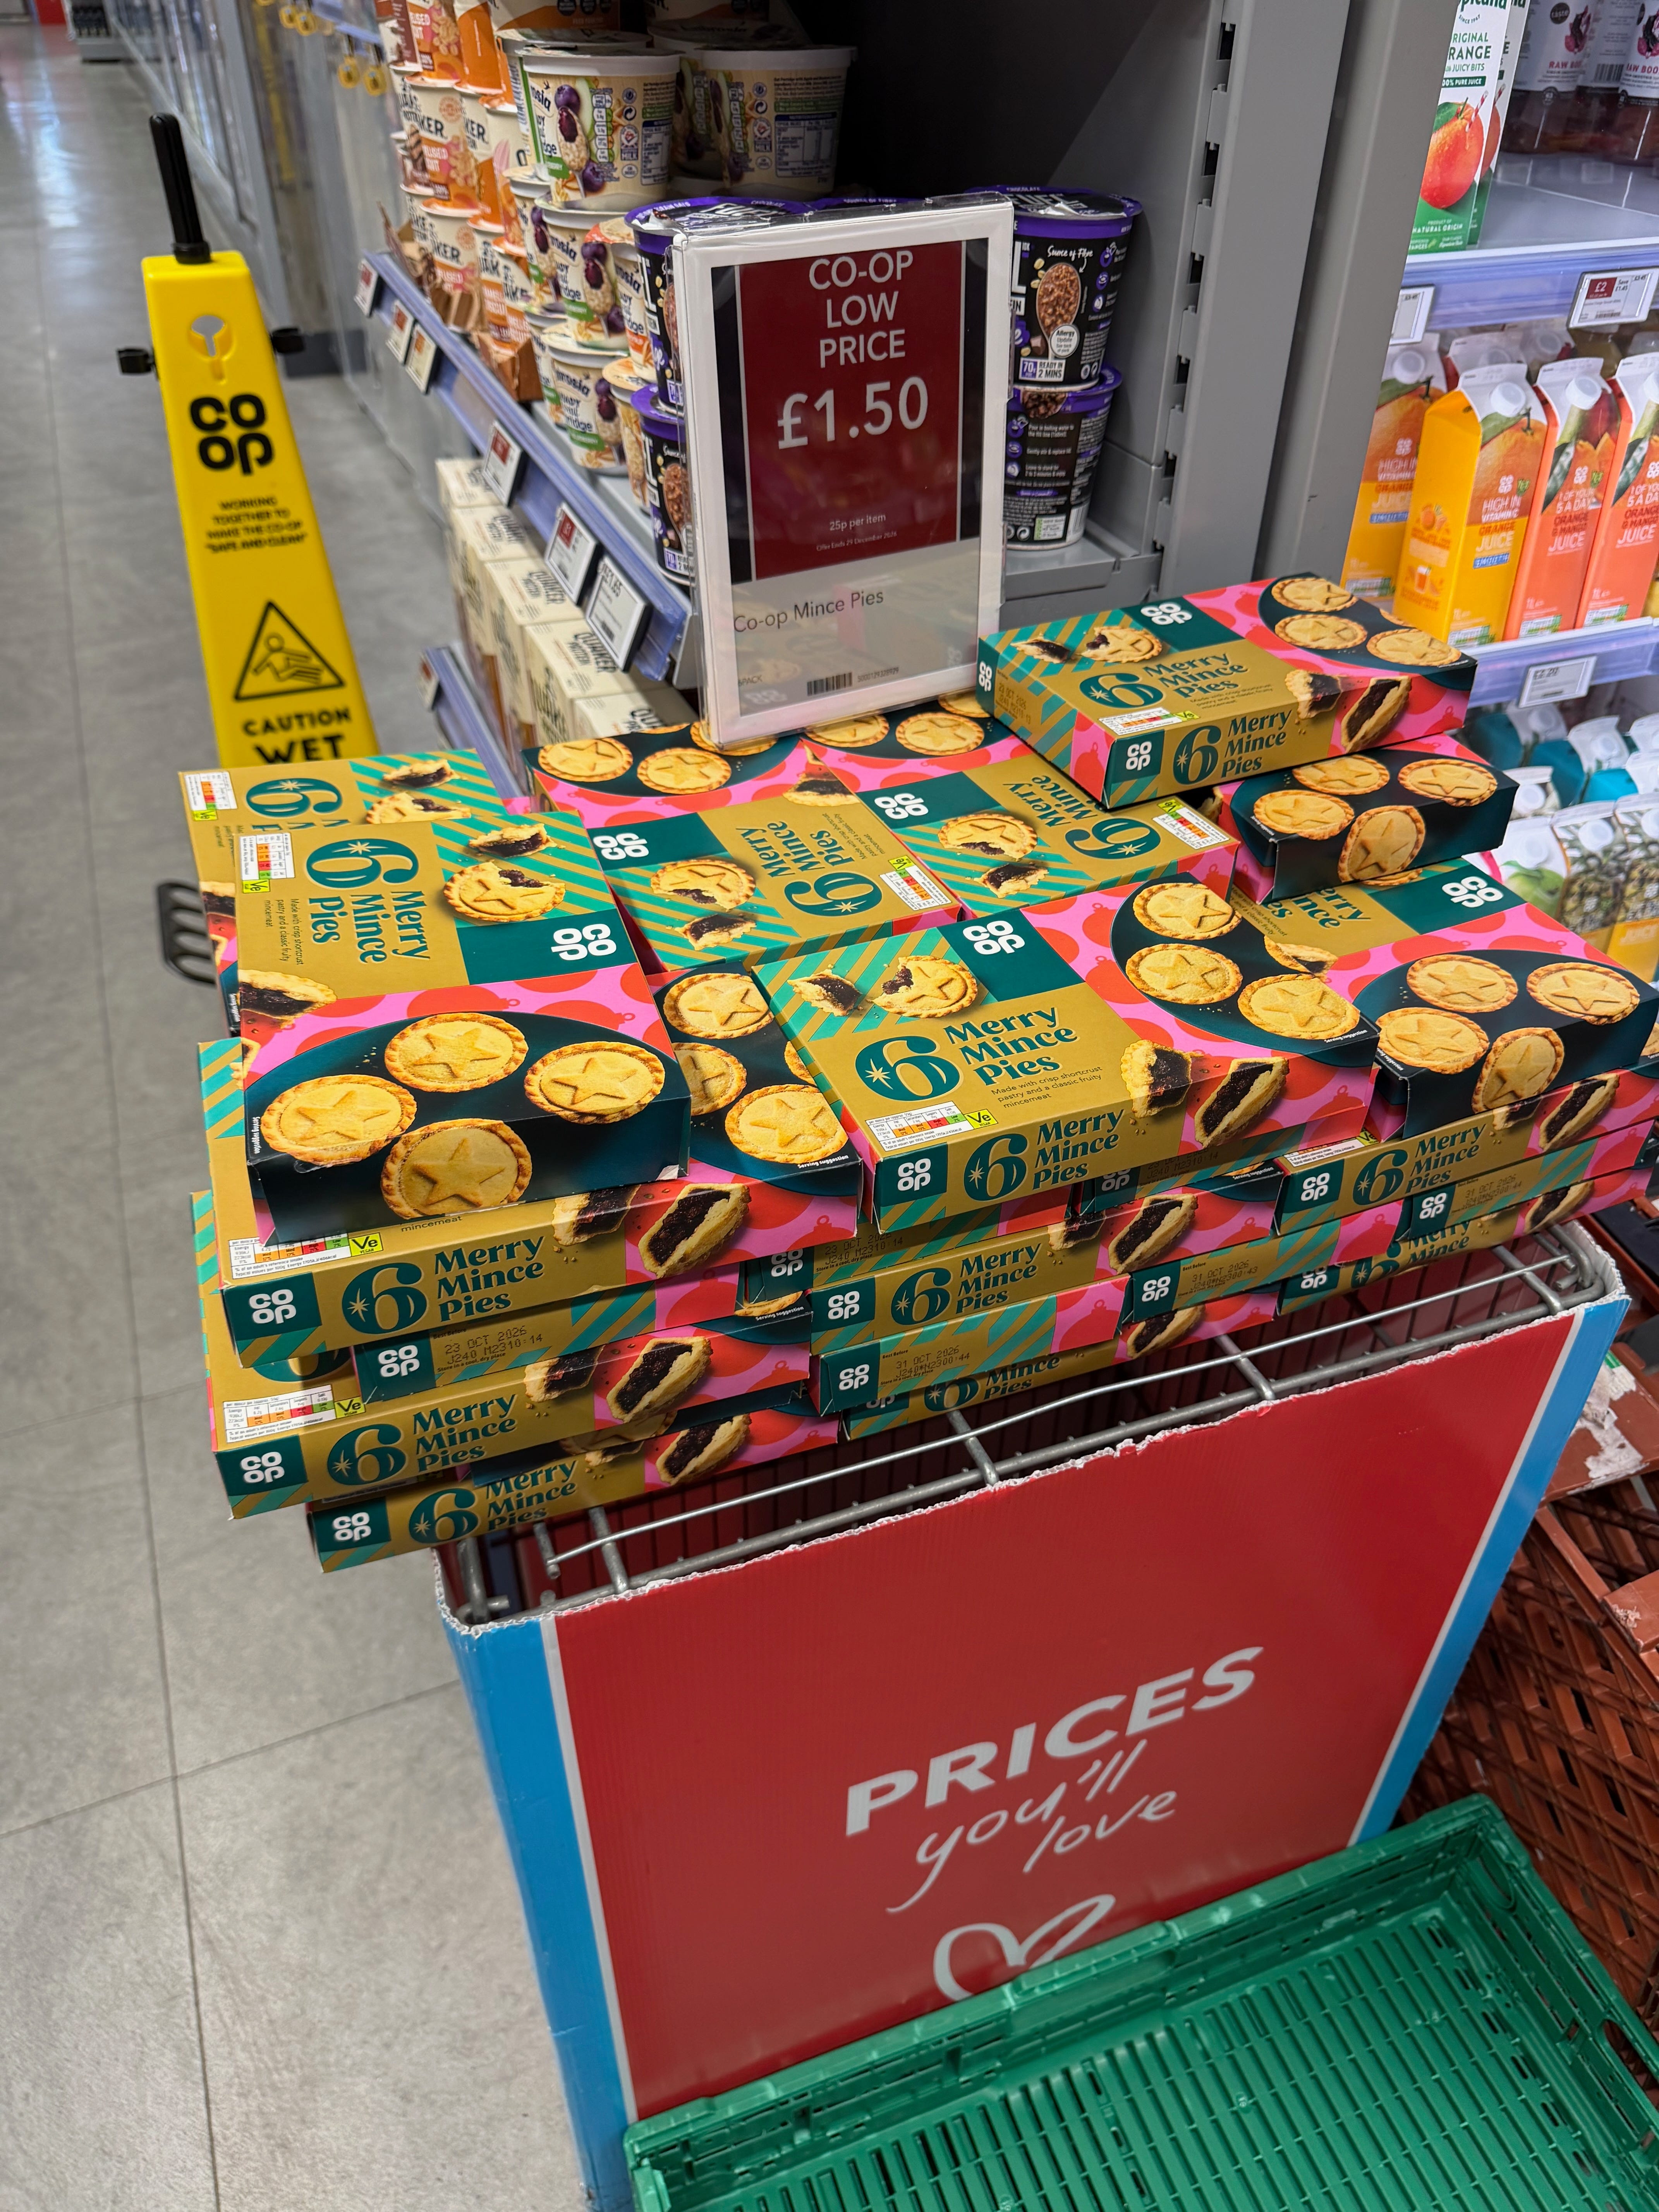
Balancing up numerous priorities for the organisation and trying to end up with a promotional package that links to the seasonal events and is relevant without being too expensive.
You have to be aware and close to the customer, you have to be relevant. Plus you have to battle back against traders who want to push margin rich ends and product/prices and also the retail media team who have more signage to display everywhere.
But it’s modern and “media” because it has a QR code.
I digress. Here is the merchant map for 2025 (Christmas) showing who landed what, when and how. Quickest isn’t always the bestest but it’s a pretty good gauge of what was available in store for customers to buy. (and when!)

We can generate this for other years, events and cross over the entire year, showing you what others did with their seasonal space, and when.
We have 56 (or so) events that we have on file, through Delphi (our seasonal platform) which holds all the new product development, shippers and AI intelligence.
Enabling you to generate your own trade plan, seasonal offering and to ensure you’re learning from the best and not missing a thing in your own offering.
Whether that’s category, or you’re a wider retailer. Kanops can help.